

Introduction
Housing affordability is commonly assessed using income-based indicators such as the rent-to-income ratio and house-price-to-income ratio. These two measures reflect the financial burden of housing relative to the earnings of household. Several house price-to-income ratios are used by policymakers and housing sector analysts to observe housing affordability both for home buyers and renters.
Among the methods used to determine housing affordability for homeowners, three approaches are commonly used: the median multiple, the housing cost burden and the residual income. The housing cost burden and the residual income approaches both measure the ability of households to purchase a home based on the amount of housing loan they can qualify for. In this way, both the housing cost burden and residual income approach are influenced by factors or policies related to housing finance. The median multiple approach considers only at the price of housing relative to income, whereby a house is considered affordable if it is less than three times a household’s median annual income.
In this article, the median multiple approach has been used as the primary indicator for housing affordability for homeowners1, given the tendency for both the residual income and housing cost burden approaches to skew house prices higher.
Housing affordability in Malaysia has marginally improved
In 2024, the median multiple affordability for Malaysia’s housing market recorded a score of 4.2. This categorizes it as “seriously unaffordable” and indicates that homes are still beyond the reach of many Malaysians. Since the introduction of the first National Housing Policy in 2012, the median multiple for the country has stayed persistently within the “seriously unaffordable” category (a score of between 4.1-5.0). This is due primarily to the persistently higher growth of house prices when compared to the growth of household incomes.
Between 2012 and 2014, the median house price increased at a CAGR of 23.1% from RM170,000 to RM270,000. During the same period, median household incomes grew significantly slower at a CAGR of 11.7%, less than half the rate of increase in house prices. Since then, the gap in the growth rate between household incomes and house prices have slightly narrowed. This is also reflected in the improvement of the median multiple affordability from 4.9 in 2014 to 4.2 in 2024.
Figure 1: Household income versus house prices, 2002 - 2024
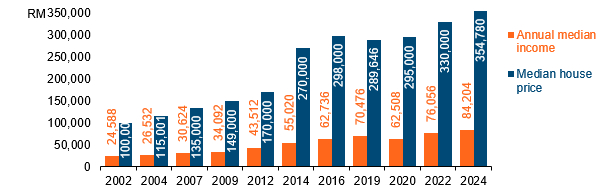
Table 1: Compounded annual growth rate (CAGR), 2012-2024

Figure 2: Comparison of the House Price Index against its annual growth rate, 2010-2024
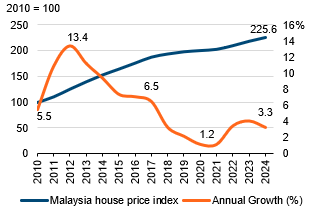
Figure 3: Median multiple affordability, 2002 - 2024
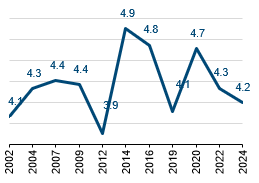
To note, the introduction of a price threshold for the affordable housing segment through the National Affordable Housing Policy in 2019 is aligned with the observation that the median house price for the country remained around the RM300,000 mark between 2016-2020. Changes in the median multiple affordability during this period can be mostly attributed to the improvement or deterioration in Malaysia’s median household income. This is particularly evident when we observe a significant deterioration in housing affordability in 2020 despite moderate growth in the median house price, as household incomes plunged during the Covid-19 global pandemic.
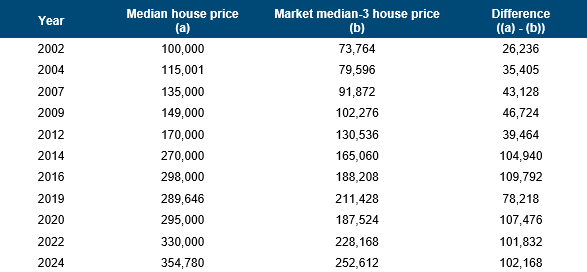
Table 2: Comparison of median house price against the corresponding market median-3 price for Malaysia, 2012 – 2024
Housing affordability varies widely across states
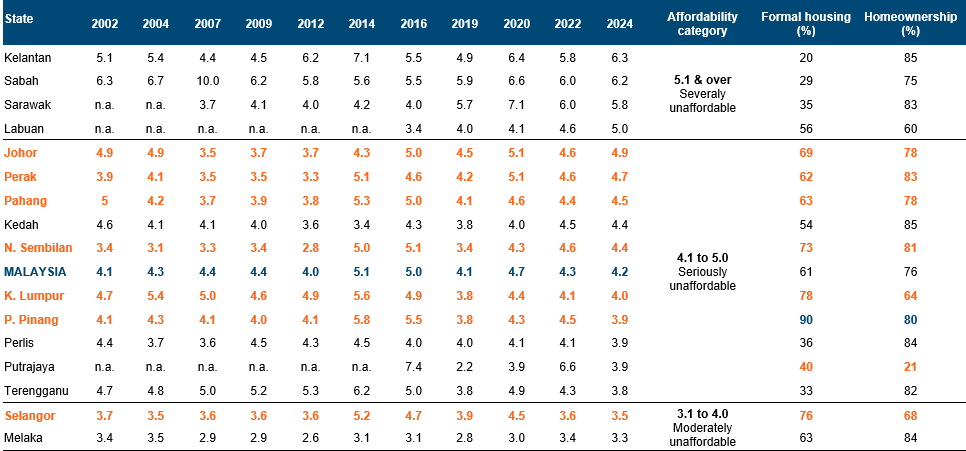
While housing affordability at the country level for Malaysia has stayed consistently within the “seriously unaffordable” category, some states have fared better than others. Between 2012-2024, the multiple affordability for Selangor and Melaka remains in the “moderately unaffordable” category for most years. In contrast, Negeri Sembilan and Perak saw a deterioration in housing affordability in their states, recording a jump to 4.4 and 4.7 in 2024 from 2.8 and 3.3 respectively in 2012. The interplay between household incomes and housing affordability is apparent when the housing affordability analysis for Perak and Melaka is compared. The median house price in 2024 for these two states are RM265,000 and RM270,000 respectively, both registering below the RM300,000 price ceiling for the affordable housing segment. Nevertheless, differences in their household median incomes placed each state in different affordability categories.
However, it is evident that the RM300,000 price cap for the affordable housing segment does not reflect the true housing affordability of households in the country. Based on the calculation of their market median-3 house price, as of 2024, houses within the affordable housing segment can only be categorized as affordable for households in Kuala Lumpur, Putrajaya and Selangor. There is a need to consider whether the RM300,000 price threshold for the affordable housing segment is detrimental to housing markets outside of the Greater Kuala Lumpur (GKL) conurbation.
Table 3: Comparison of housing affordability based on annual household median income and median all-house price across states in Malaysia, 2024

Source: DOSM (2022), DOSM (2025), NAPIC (2026) and KRI calculations
Table 4: Median multiple affordability by state, 2002 – 2024
Source: DOSM (2022), DOSM (various years.), NAPIC (various years) and KRI calculations
Additionally, housing affordability in the country must be assessed against the context of both the level of housing formality as well as high homeownership rates in the country, particularly when comparisons between different states are made. For example, as illustrated in Table 3, whilst Kelantan, Sabah and Sarawak report a high median multiple score of 6.3, 6.2, and 5.8 respectively in 2024, the low rates of formal housing and high rates of homeownership suggest that the housing needs of many households in these states may be supported by housing provisions delivered through the informal housing sector (e.g. kampung houses, longhouses, etc). Similarly, Putrajaya (as detailed in previous section) hosts a large proportion of government quarters as the administrative capital of Malaysia, through which many residents address their housing needs. Despite a median multiple score of 6.6 in 2022, the housing affordability score for Putrajaya may not be accurately representative given that most households (71.1%) in the state are able to acquire housing through the government quarters system.
Policy considerations - Assessments and interventions to improve housing affordability must use localized data on household incomes and expenditure
It is evident that the RM300,000 price cap for the affordable housing segment does not reflect the true housing affordability of households in the country. There is a need to consider whether the RM300,000 price threshold for the affordable housing segment is detrimental to markets outside of the Greater Kuala Lumpur (GKL) conurbation. More importantly, housing affordability assessments and the corresponding interventions must reflect the spatial dimension of housing as a secure base from which people carry out all of life’s functions. Whilst the data and calculations presented in this article are useful in describing the housing affordability levels across different states, they likely conceal sharp differences within and across metropolitan regions.
Ultimately, housing affordability cannot be separated from accessibility. A home that is three times annual income, but requires long, costly and stressful commutes is not truly affordable. The median multiple, when recalculated at the Housing Market Area level, would provide a sharper tool for assessing real affordability than state-level averages. To do this, Ministry of Housing and Local Government (KPKT) needs to utilize data at a more granular level to calculate and monitor the housing affordability for the country. Thus, KRI welcomes the recent announcement by KPKT to use and incorporate big data analytics to enhance the overall data capacities and capabilities for the housing sector.