








Introduction
Any analysis of the housing market must begin by looking at the dynamics between housing demand and supply. The conditions of housing demand and supply must be measured, analysed and understood at the right spatial scale (be it mukim or state levels) of the housing market area to identify effective policy interventions to improve the responsiveness of the housing sector.
Many factors affect the demand for and supply of housing. To assess the effectiveness of the interaction between housing demand and supply in the market, firstly it is important to fully understand how housing demand emerges in the housing market and consequently, how housing supply responds to meet the demand for housing.
In this article, the gap between housing demand and supply in three states in Malaysia are identified and analysed. Ultimately, the needs and demand for housing must be reconciled with the existing housing stock or incoming supply of new stock as well as the capacities of housing providers. These assessments provide the relevant evidence for the proper planning and provision of housing in any locality.
The gap between housing demand and supply
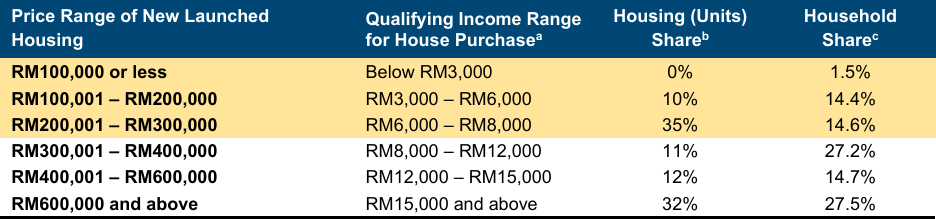
Mismatches between housing demand and supply occur when houses made available in the housing market do not reflect the preferences and financial resources of households that require housing. In Malaysia, the comparison of the share of households by income deciles against the composition of new housing supply available to purchase in the housing market indicates a distinct gap between the demand and supply of housing in the country. Figure 1 and Table 1 illustrate the discrepancy between what proportion of new housing is available to households relative to their income group.
Figure 1: Housing demand-supply mismatch in Malaysia, 2024
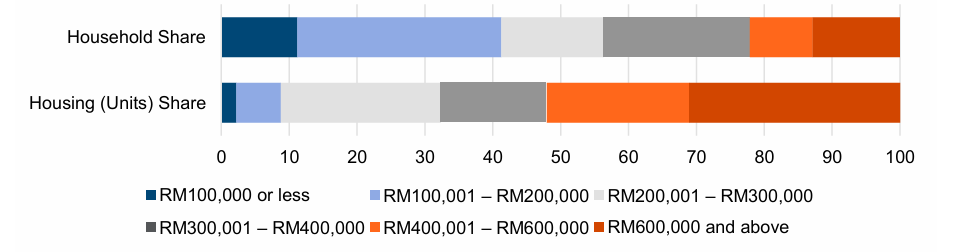
Table 1: Distribution of new housing units against household share, by income group, Malaysia, 2024

(a) The qualifying income range for house purchase is estimated using a median multiple-3 ratio of 3x annual household income, a standard benchmark for housing affordability.
(b) The housing (units) share is the proxy for housing supply. This reflects the proportion of new housing units that are affordable to each corresponding income bracket. Houses are deemed affordable if they are priced below three times the annual household income. For example, a RM200,000 house is considered affordable to households earning at least RM5,556/month or RM66,667/year.
(c) The household share is the proxy for housing demand. This reflects the proportion of households that exist in each income bracket. Source: DOSM (2025), NAPIC (2024), KRI calculations
Households which earn a monthly household income of below RM3,000 make up approximately 11% of the total population. However, only 2% of total new housing supplied by the market is considered affordable for this segment. This finding is unsurprising as this segment of the population may be represented by those most vulnerable in society, rendering them most likely in need of housing from the social sector. Furthermore, our findings indicate that only 9% of new housing supplied by the market is considered affordable to the bottom 41.3% of households in Malaysia. These households, which earn a monthly income of below RM6,000, can only afford houses in the RM200,000 and below price segment.
In contrast, households in the topmost income quintile (i.e. those who earn a monthly household income of above RM12,000) make up 22% of the population but are able to access a wider range of offerings in the housing market as 52% of newly launched housing units are priced within the affordability range of their household income bracket. This also demonstrates that more than half of newly launched housing units are not considered affordable to most households (78%) in Malaysia.
Whilst it is important to highlight the demand-supply mismatch at the national level, it is more useful to do the same analysis using more granular data to understand the dynamics of demand and supply at each state/locality/housing market area. In this article, we are only able extend the analysis using state level data for Kuala Lumpur, Johor and Pulau Pinang, given the limitation of both time and data.
Figure 2: Housing demand-supply mismatch in Kuala Lumpur, 2024
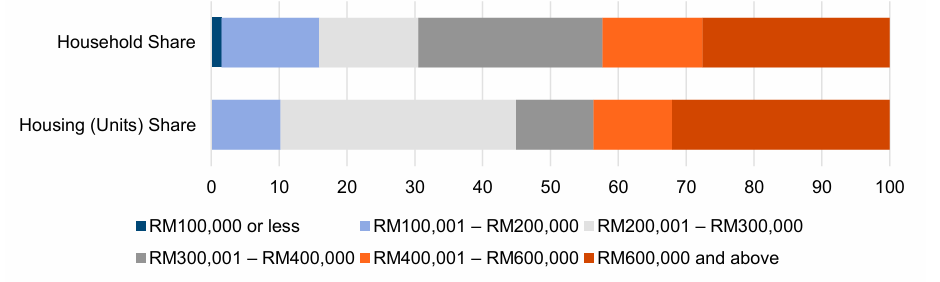
Table 2: Distribution of new housing units against household share, by income group, Kuala Lumpur, 2024
(a) The qualifying income range for house purchase is estimated using a median multiple-3 ratio of 3x annual household income, a standard benchmark for housing affordability.
(b) The housing (units) share is the proxy for housing supply. This reflects the proportion of new housing units that are affordable to each corresponding income bracket. Houses are deemed affordable if they are priced below three times the annual household income. For example, a RM200,000 house is considered affordable to households earning at least RM5,556/month or RM66,667/year.
(c) The household share is the proxy for housing demand. This reflects the proportion of households that exist in each income bracket. Source: DOSM (2025), NAPIC (2024), KRI calculations
In Kuala Lumpur, our findings indicate that the national affordable housing threshold price of RM300,000 may have influenced new housing production to match population demands. Based on our analysis, in 2024, households in Kuala Lumpur are well served by the supply of new housing in the state across the entire income spectrum.
A total of 45% of new launched housing in the state are priced below the affordable housing threshold of RM300,000. An additional 11% of new launched housing are priced between RM300,001-RM400,000. These two segments combined (56%) is considered affordable to approximately 58% of the population in Kuala Lumpur, i.e. household which earn a monthly income of below RM12,000. Likewise, newly launched housing in the RM400,001-RM600,000 and above RM600,000 make up 44% of total new housing and are considered affordable to approximately 42% of households in the state.
To note, however, new launched housing priced above RM900,000 make up a significant share of housing in the last category of our analysis (i.e. housing priced above RM600,000). Housing in this price segment make up 22% of total new launched housing supplied by the market in 2024 and can only be considered affordable to households earning a monthly income of RM25,000 and higher. However, our analysis for this segment is limited by the lack of more granular data on household income, which currently categorises all households earning a monthly income of RM15,000 in the same income group.
Figure 3: Housing demand-supply mismatch in Johor, 2024
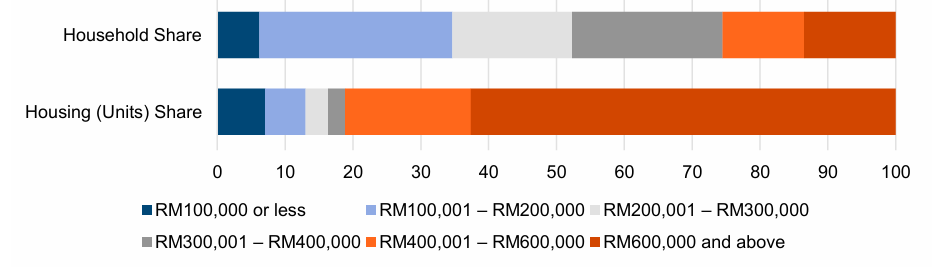
Table 3: Distribution of new housing units against household share, by income group, Johor, 2024
(a) The qualifying income range for house purchase is estimated using a median multiple-3 ratio of 3x annual household income, a standard benchmark for housing affordability.
(b) The housing (units) share is the proxy for housing supply. This reflects the proportion of new housing units that are affordable to each corresponding income bracket. Houses are deemed affordable if they are priced below three times the annual household income. For example, a RM200,000 house is considered affordable to households earning at least RM5,556/month or RM66,667/year.
(c) The household share is the proxy for housing demand. This reflects the proportion of households that exist in each income bracket. Source: DOSM (2025), NAPIC (2024), KRI calculations
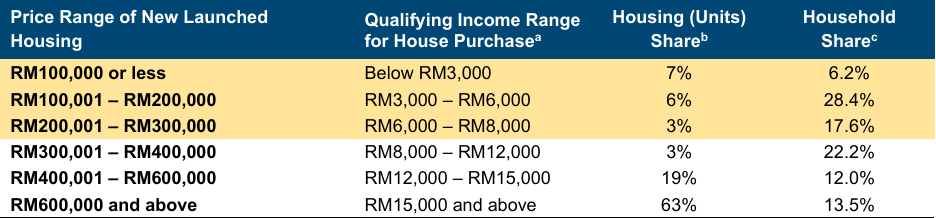
In Johor, our findings indicate that new housing production in the state is severely skewed towards the paying capacity of high-income households and fundamentally ignores the income distribution of households in the state. In 2024, more than 80% of new launched housing in the state is priced above RM400,000 rendering it affordable to only 25.5% of households in Johor. These households earn a monthly income of RM12,000 and above. In contrast, only 16% of new launched housing in the state can be considered affordable to the bottom half of households in Johor during the same period. Furthermore, only 16% of new launched housing in the state were priced below RM300,000 (national affordable housing price threshold) in 2024.
The extreme mismatch between housing demand and new housing supply in Johor warrants further investigation to understand the critical factors leading to this dysfunction. Of note, new launched housing priced within the RM600,000 and above segment make up 63% of total new supply in 2024. Housing in this price segment is considered affordable to only 13.5% of households in Johor. Within the segment, houses in the RM700,001-RM800,000 and above RM1,000,000 price segments respectively make up 21% and 17% of total new launched housing for the year. The disproportionate development of high-priced housing could indicate that these housing developments may have not been targeted for purchase by the local population. Nevertheless, to discern whether the current mismatch is merely an anomaly or a more structural trend for the Johor housing market, the demand-supply mismatch analysis for Johor needs to be supplemented with further analysis of the market over a longer time period.
Figure 4 Housing demand-supply mismatch in Pulau Pinang, 2024
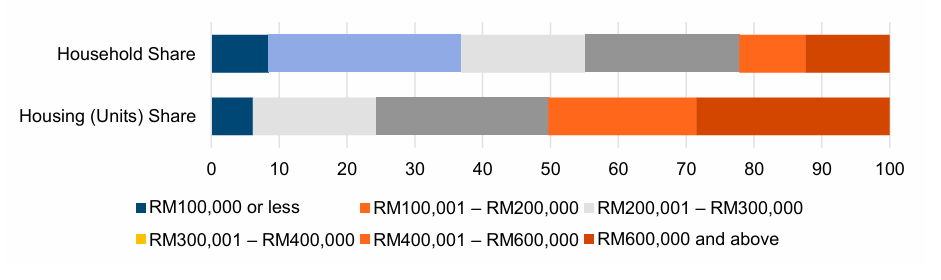
Table 4: Distribution of new housing units against household share, by income group, Pulau Pinang, 2024

(a) The qualifying income range for house purchase is estimated using a median multiple-3 ratio of 3x annual household income, a standard benchmark for housing affordability.
(b) The housing (units) share is the proxy for housing supply. This reflects the proportion of new housing units that are affordable to each corresponding income bracket. Houses are deemed affordable if they are priced below three times the annual household income. For example, a RM200,000 house is considered affordable to households earning at least RM5,556/month or RM66,667/year.
(c) The household share is the proxy for housing demand. This reflects the proportion of households that exist in each income bracket. Source: DOSM (2025), NAPIC (2024), KRI calculations
In Pulau Pinang, households which earn a monthly household income of below RM6,000 make up approximately 37% of the total population, however, only 6% of the total new housing supplied by the market is considered affordable for this segment. The lack of new housing (0%) in the RM100,001-RM200,000 price segment severely impairs the effectiveness in meeting the housing demand for households in this segment. In contrast, new launched housing in the RM400,000 and above segment make up half (50%) of total new housing supplied by the market in 2024. However, only 22% of households in Pulau Pinang would consider these houses affordable.
Furthermore, our findings indicate that only 24% of new housing supplied by the market is considered affordable to the bottom 55% of households in Pulau Pinang. These households, which earn a monthly income of below RM8,000, can only afford houses in the RM300,000 and below price segment, which is in line with the national price threshold for affordable housing. Whilst the threshold has been accurately estimated for the state, it is not effective in shifting housing production to meet housing demand in Pulau Pinang.
Policy considerations – Anchor housing to household needs and demand
The distinctive trends observed in all three states further illustrate the need for more localized housing provision strategies to reduce the mismatch between housing demand and supply. The state level analysis undertaken for Kuala Lumpur, Johor and Pulau Pinang illustrate that policy targets at the national level (e.g. the indicated price threshold of RM300,000 for affordable housing) may not be meaningful or accurate when implemented at more local levels. These targets may improve housing market conditions in one locality (in this case, Kuala Lumpur) whilst at the same time, deteriorate/stall housing markets in other localities (i.e. Johor and Pulau Pinang). KPKT’s recent announcement to review the RM300,000 price threshold for affordable housing is timely and will allow for a more accurate evaluation of housing affordability in the country.
Additionally, more comprehensive and frequent evaluation and monitoring of demand-supply gaps in local housing markets must also be undertaken to ensure unfavourable structural trends are identified early and addressed effectively. In the case of Johor, the extreme mismatch between the paying capacity of households and the housing supplied by the market, if observed consistently over a longer time span, may point to detrimental development practices in the state. Early detection of these trends may allow policy makers to take corrective steps to alleviate their destructive effects to the local housing market.
Ultimately, the disconnect between housing demand and housing supply (proxied by the income distribution of households and the supply of new housing in this analysis) indicates a more systemic weakness in the Malaysian housing market. Except for Kuala Lumpur, housing developments in Malaysia can be said to disregard the preferences (i.e. needs and demands) of the Malaysian population. Thus, in terms of pricing, housing development in Malaysia do not exhibit characteristics of being demand driven, rather, the development of new housing is likely led and determined by supply-side capacities and constraints.
%20(1)%20(1)%20(1)%20(1)%20(1).avif)