


.png)






In late July, Malaysians were greeted by the unsettling news that 2026 is on course to be the country’s worst year for job losses since 20201. By mid-June, 42,807 workers had registered a loss of employment with PERKESO.2Job losses in the first five months of the year ran 36% ahead of the same period in 2025.3
Within economies, a churn of job losses and eventual rehiring is largely regarded as expected4, as both employers and employees try to find the best possible match for one another. But the most striking part of the recent news, however, was not only the scale involved, but also who were being retrenched, and where. Half of those losing jobs were professionals, managers, executives and technicians, and the losses were concentrated in Kuala Lumpur and Selangor.5
Prior to COVID, job losses in Malaysia tend not to fall on professionals, and past retrenchment waves, in 1998 and 2009, fell hardest on production workers, not professionals.
Crisis-era job losses in Malaysia used to fall on the factory floor. Of the 83,865 workers retrenched in 1998, Bank Negara’s count puts production workers at 54% and managers at just 7%; in 2009, plant and machine operators alone accounted for four in ten retrenchments reported to the Labour Department.6 The pandemic was the first recorded incident where this pattern didn’t apply: by 2020, managers, professionals and technicians were already 42% of notified retrenchments.7
The pattern of white-collar job losses in Malaysia is also seen globally. In the United States, Challenger, Gray & Christmas counted 1.2 million announced job cuts in 2025, the most since the pandemic year of 2020.8 Amazon alone has announced some 30,000 corporate job cuts since October 2025, concentrated in engineering and middle management rather than in its warehouses.9
Early explanations point to AI. For five consecutive months through July 2026, AI was the single most-cited cause of announced layoffs in the US, and cuts attributed to AI went from about 5% of the total in 2025 to nearly a quarter in the first half of 2026.10
Is AI the reason behind job losses in Malaysia?
In Malaysia, that question is increasingly being put to the test. Analysing PERKESO’s loss-of-employment records, Cheng (2026) finds that claims have roughly tripled since 2022, with the increase concentrated among occupations most exposed to AI. In his estimates, the most exposed occupations show around 69% more job losses than the sample average, a gap that roughly doubled between 2023 and 2025.11
However, the Human Resources Minister, R. Ramanan, has drawn the opposite conclusion, telling Parliament in June that the data does not support AI as the driver of this year’s retrenchments.12
Cheng (2026) doesn’t attribute causality to his findings, meaning he doesn’t claim there is a confirmed link between AI and job losses, but this does raise an important question worth exploring.
If AI is causing job losses, how would anyone know for sure? This article argues that the evidence available today cannot yet establish that link. Measures of AI exposure tell us which jobs could be affected, but not whether firms have actually adopted the technology or displaced workers because of it.
The article examines what exposure measures can and cannot tell us, and what economic theory and history suggest would have to happen before AI produces a genuine displacement wave. The conclusion is therefore “not yet”, rather than “not ever”: AI may eventually reshape employment substantially, but there is little basis for attributing Malaysia’s current retrenchment wave to it. More fundamentally, Malaysia still lacks the data needed to know for sure.
Why the attribution of job losses to AI is premature
The ISIS paper describes its own estimates as descriptive, not causal, and the caution is well placed.13 Attributing the retrenchment wave to AI is premature, because the evidence behind the attribution cannot yet separate AI from everything else that has hit the same jobs.14
The global numbers rest heavily on what firms say, and firms have reasons to say that it’s AI, rather than more incriminating reasons like ‘over-hiring’ or misallocation.
The more serious evidence, which includes the Malaysian findings, relies instead on exposure measures. Exposure measures are constructed indices that score an occupation by how many of its tasks AI could, in principle, perform. For example, the index behind the Malaysian study works exactly this way. Cheng and colleagues, in a joint study with the World Bank, took the official task lists that Malaysia’s occupational classification keeps for every job, asked a large language model to rate how automatable each task is, and averaged those ratings into a score for each occupation.15
As a signal of where to look first, exposure is genuinely useful, and the Malaysian mapping by Cheng and colleagues, which finds that about 28% of the labour force is highly exposed, is exactly the right kind of starting exercise.16 But exposure measures technical possibility, not impact. And just because something can happen, it does not mean it will. A high score says AI could do many of a job’s tasks, not that any firm has actually deployed it against them or that when it is deployed, these jobs will definitely disappear as a result of being automated.
A natural example would be the introduction of the automated teller machine (ATM) and what it did to bank tellers. Had anyone built an exposure index in the 1970s, the bank teller would have sat at the top of it. The ATM took over the task at the centre of the job, handling cash. Yet full-time teller employment in the United States rose for decades after the machines spread.17
Figure 1: Bank tellers and automated teller machines in the United States
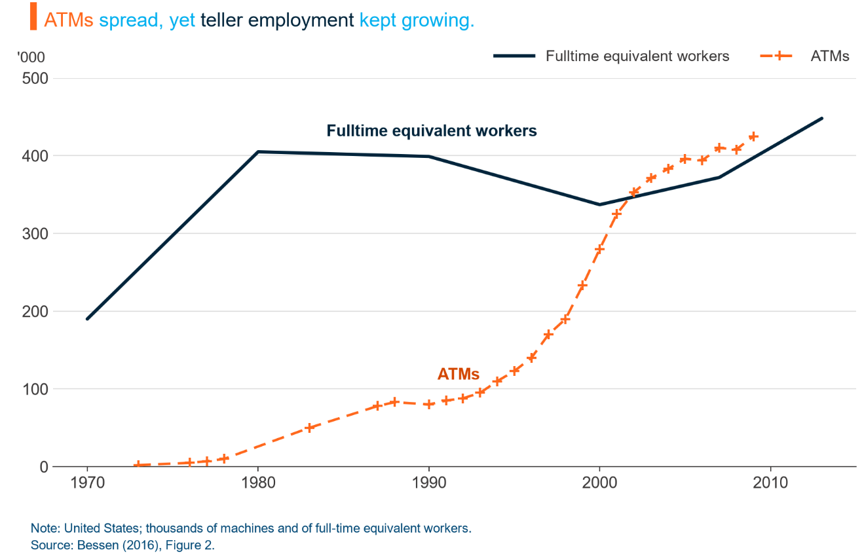
The ATM machine made a branch cheaper to operate, so banks opened many more of them. Tellers per branch fell from about 20 in 1988 to 13 by 2004, but branches multiplied fast enough to keep total teller employment growing.18 The job also recomposed over time. With cash handling automated, the skills that mattered were the ones the machine lacked, selling and dealing with customers, and the teller recomposed into something closer to a salesperson.
What this example shows us is how ‘exposure’ as it is measured is still largely theoretical and the underpinning mechanism behind how exposure will result in job losses is still unclear. This should be a cause of concern for those attributing job losses based on exposure measures.
Recent evidence on AI and job losses
Fortunately for us, this question of AI exposure and its impact on jobs has been explored by several well-composed papers on a complementary question: AI and new hires.
Through 2025, the sharpest version of the AI story was about its impact on entry-level work. The hiring of young workers in the most exposed occupations, e.g., junior software developers, declined noticeably, and AI was the presumed cause19.
The best treatment of this question comes from Lambert and Schindler, who set out to measure whether generative AI was really what broke the ‘entry ladder’. Their dataset is also the largest assembled on the question: 243 million hiring records and 407 million job postings across four English-speaking economies, tracking occupation by occupation, the share of new hires going to junior workers.20
Figure 2: Junior hiring and generative AI exposure, with and without the work-from-home control
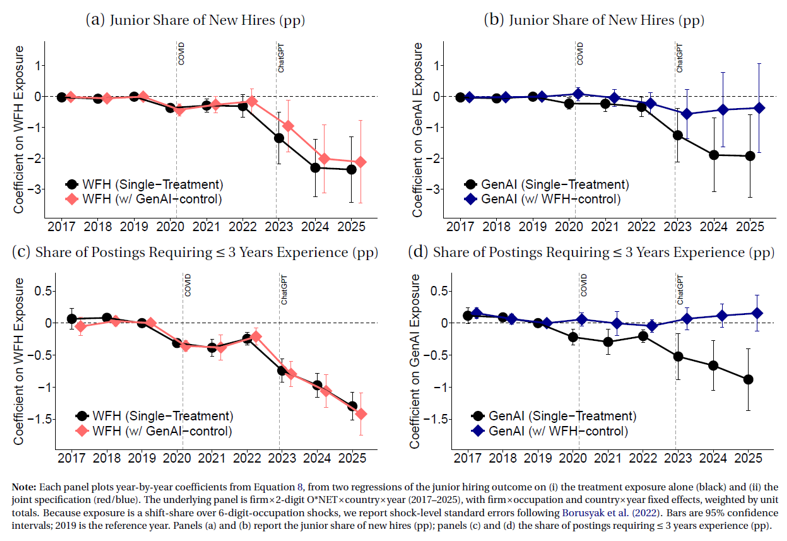
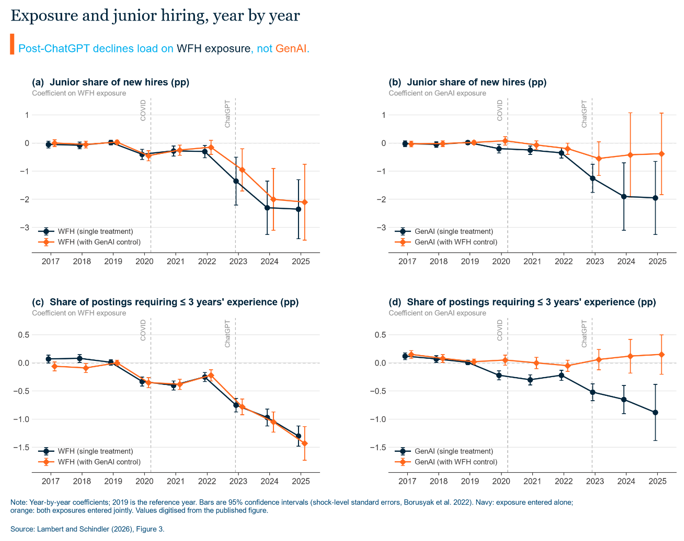
Tested on its own, the AI story holds up. Occupations more exposed to Gen AI saw junior hire share fall by around five percentage points by 2025. But what was striking about the paper was what happened when the authors also accounted for another characteristic of these occupations: their suitability for Work-From-Home (WFH).
The results of the authors is best shown by Figure 2 above. Figure 2 shows a clear asymmetry. In Panel (a), occupations more suited to WFH saw larger declines in the share of junior hires, and this relationship remains largely unchanged after controlling for Gen AI exposure. Panel (b) shows that the reverse does not hold: once WFH exposure is taken into account, the estimated relationship between Gen AI exposure and junior hiring largely disappears. The same pattern appears in Panels (c) and (d), which look instead at job postings requiring little prior experience. WFH exposure remains predictive even after accounting for Gen AI, while the apparent Gen AI effect weakens substantially once WFH exposure is included.
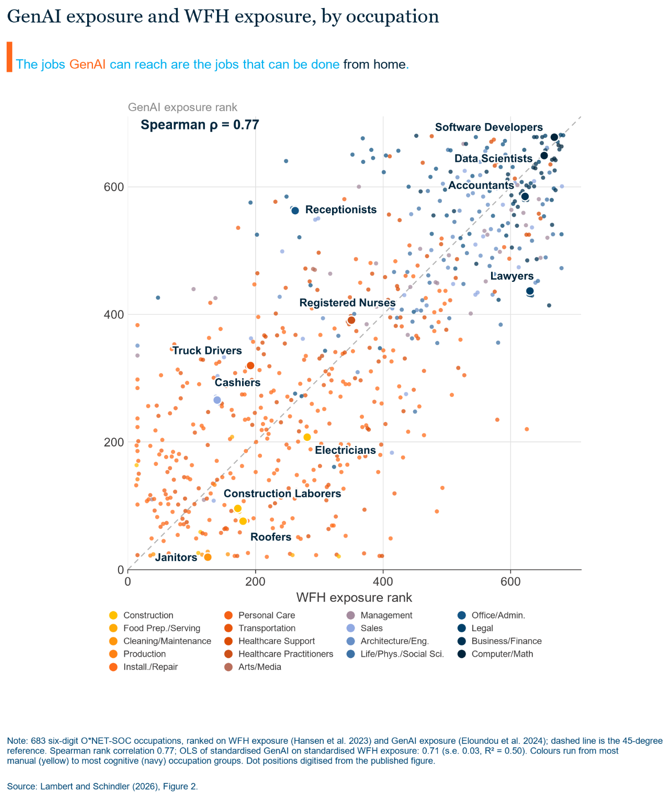
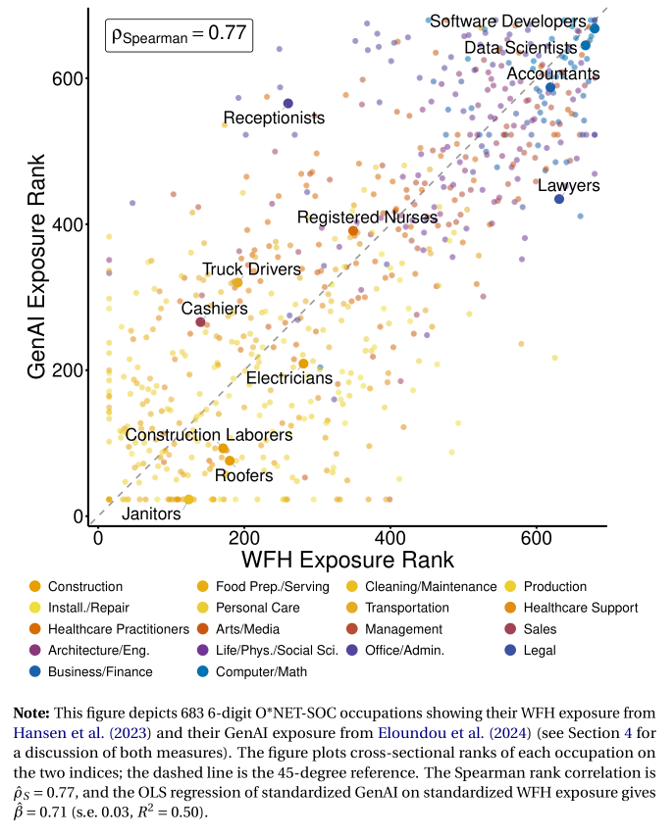
Why does controlling for WFH change the Gen AI result so dramatically? The answer is that the two exposure measures tend to identify many of the same occupations. Across occupations, the AI-exposure ranking and the remote-suitability ranking correlate at 0.77, which means that jobs ranked as highly suitable for remote work also tend to be ranked as highly exposed to Gen AI. Figure 3 makes this overlap clear. Jobs such as software developers, accountants and lawyers tend to rank highly on both measures.
Figure 3: Generative AI exposure and work-from-home exposure across occupations
When should we be worried about AI-caused job losses?
While attributing job losses to Gen AI should be considered premature for now, the instinct underlying the attribution is still worth paying attention to. History is filled with episodes where the introduction of technology at the workplace caused anxiety.
Why shouldn’t we be worried of technology? And more importantly, when should we be worried of technology? While AI is spectacular in its range and depth of complexity, its relationship with jobs will still follow the same series of intermediating factors that other technologies before it have experienced.
Jobs are bundles of tasks. A payroll clerk processes entries, but also audits exceptions, fields queries from staff and explains the numbers to management. What a firm buys when it hires is the bundle and not any single task. When a new technology comes in, it rarely takes the bundle, it takes tasks. The tasks it absorbs are lost to the worker, which we call displacement. But displacement alone does not destroy the job, because most firms carry a backlog of work they wished they had the capacity to do, so when some tasks get automated, tasks migrate out of that backlog and into the job. Sometimes, new tasks are created around the technology itself, which is called ‘reinstatement’. Over time, the job is usually not eliminated but recomposed. This is exactly what happened to bank tellers, the machine took the cash-handling, and the job rebuilt itself around sales and service.
So when should we expect a displacement wave? For a general-purpose technology like AI, a displacement wave becomes possible only after firms redesign work around the technology. Historically, a redesign like this has been a large endeavour and has taken decades, if not centuries to integrate. The steam engine took between 80 to 100 years to go from invention to general use, while electricity took 40 to 50 years.21
What is often not reported is the companion technologies required for general-purpose technology to become viable. Technologies don’t stand alone. Electricity needed grids, supply generation and electric motors to finally become a viable general technology. Factories, for example, could only consider using electricity once all that technology was figured out before they could even begin to take the risk of reorganising the factory floor. And even when the whole package is figured out, and for this new ‘business model’ to be a proven winner, it has to diffuse to other firms before it becomes general use.
Understanding Gen AI through this lens does give the question of AI’s impact a testable form. If AI were driving today’s retrenchments, adoption would already have to be at production scale, with firms running AI inside core business processes rather than piloting it at the edges. Early evidence has been stark, according to one report from an MIT-affiliated group, roughly 95% of enterprise AI pilots show no measurable return.22 Admittedly, that figure rests on a non-random sample and should be treated with caution, but more careful evidence points in the same direction. In the US Census Bureau’s survey of businesses, fewer than one in ten firms use AI in production,23 and in a separate survey of some six thousand executives, roughly nine in ten report no effect of AI on employment or productivity to date.24
Where adoption is measured directly rather than proxied by exposure, we obtain a sharper answer. Danish administrative data covering thousands of adopting workplaces show no effect of chatbot adoption on earnings or hours, with estimates precise enough to rule out changes larger than 1%.25
Malaysian data still makes measuring adoption difficult but if global data is any indication, whatever that is driving a 36% rise in Malaysian retrenchments is unlikely to be a technology most firms have yet to deploy effectively.
History’s pattern is that the effects of a general-purpose technology arrive late and then quickly, once the redesign is worked out and copied. So while the verdict is ‘not yet’, it does not mean ‘not ever’. The sensible response is neither alarm nor reassurance, but instruments that would show the conditions changing.
Measure better
With the imminent rise of Gen AI, there is a present and growing need to collect better data to better understand the scale of the AI wave, should it come to our shores. If the AI wave had happened today, Malaysia would experience it as a developing country and a middle power, an AI taker rather than maker, meaning that studies conducted in developed countries may not necessarily apply. Attributing job losses to AI, or ruling it out, requires observing three things: which firms actually use AI and for what tasks; what happens to the workers and firms involved; and both margins of adjustment, hiring as well as firing.
For Malaysia, it already holds most of the raw materials. To track adoption, the US Census Bureau simply asks firms in a recurring survey whether they use AI in production and for which functions. DOSM should do the same. Its annual ICT survey of establishments already asks firms about computers, internet use and e-commerce. Adding a short module on whether firms use AI, in which business functions, and for what tasks would provide a recurring measure of actual AI adoption26. Fortunately, the Economic Census is now asking establishments about AI adoption for the first time.27
The second item would be linkage. The Danish study that produced the cleanest estimates anywhere did so by joining an adoption survey to administrative records that follow every worker and firm. For Malaysia, EPF, SOCSO and DOSM each hold part of the information and the quarterly formal-sector wage series already built from them shows the linkage is technically possible. The final missing item would be a matched, de-identified research panel.
With those two pieces in place, the question this article opened with becomes answerable. The adoption module identifies which firms actually use AI, while the linked panel shows what happens next. It lets us look into whether workers at adopting firms face higher retrenchment risk than comparable workers elsewhere, whether their earnings suffer and whether adopting firms quietly stop hiring junior hires.
The honest answer to “Is it AI?” is that Malaysia cannot currently know. That is a more useful finding than either side’s certainty, because it points to the one part of the problem entirely within Malaysia’s control. AI’s trajectory will not wait on Malaysian policy, and whether Malaysia sees AI’s trajectory clearly is a decision.
Appendix