


PART 1: WELL-BEING AND TIME
Can money buy happiness? Is money the only thing that makes you happy? These are some of the questions that we may have heard or maybe even asked our friends during casual conversations. Richard Easterlin, professor of economics at the University of Southern California, first suggested in 1974, that life happiness increases with average income only up to a certain point beyond which it does not increase (Easterlin 1974, 1995). In other words, the positive correlation between happiness and income is only short-term (Boo, Yen, and Lim 2016). Reisch (2001) agrees with Easterlin and states that “beyond a certain income level, the marginal utility of more available time is higher than the marginal utility of more available income”. There are many more components to happiness and well-being other than income, with time being one of the key elements.
In a world where most people are competing with one another to climb up the social and income hierarchy, time has taken a backseat in their list of priorities. As stated in Harvey and Mukhopadhyay (2007), time can be divided into four categories namely, committed time, contracted time, necessary time and free or leisure time. Committed time is time spent doing household activities such as household chores, looking after the children and the elderly in the household. It can also be viewed as time spent doing unpaid domestic and care work. Contracted time is time spent in the workforce or time spent doing paid work. Necessary time can be viewed as time spent doing activities which are considered necessary for one’s health and well-being such as eating, sleeping, etc. Free time is the balance available time for one to indulge in leisure activities such as hobbies and activities of one’s choice (Harvey and Mukhopadhyay 2007).
The fast-paced lifestyle of the people today has made the concepts of time wealth and time poverty increasingly relevant in thinking about well-being. An individual is said to be time wealthy if she or he has an excess of free time or in other words spends disproportionately more time on non-market work and less time on market work. On the other hand, an individual is said to be time poor if she or he spends disproportionately more time on market work and less time on non-market work (Vickery 1977). ‘Money-rich, time-poor’ is an expression often used to describe groups of people who, whilst having a high disposable income through well-paid employment, have relatively little free or leisure time (O’Morain 2006).
A study by Leete and Schor in the United States elaborated on the concept of time-squeeze which is the notion that long working hours are increasingly squeezing out leisure and family time from people’s lives. This has led to people adopting less leisure-oriented lifestyles which in turn has caused a decrease in the marriage and birth rates as getting married and having kids would mean that more of their leisure time would be spent doing household chores and in childcare (Leete and Schor 1994). Therefore, the phenomenon of time-squeeze has important demographic implications.
PART 2: AVERAGE HOURS WORKED IN THE LABOUR FORCE SURVEY
The Labour Force Survey carried out annually by the Department of Statistics is the only regular source of data with a time element in Malaysia. In 2017, the average weekly hours worked in Malaysia was 45.5 hours (DOS 2018). This was comparable to the average weekly hours worked in Mexico which was 45.1 hours and higher than that of Brazil which was 39.4 hours1 (OECD n.d.). However, if compared with the highly developed countries, the average weekly working hours in Malaysia is higher than Germany (34.4 hours), United Kingdom (36.5 hours) and United States (38.6 hours)(OECD n.d.). Figure 1 shows the average number of hours worked by men and women from 2010 to 2017. The average hours worked by women dropped more than men from 2010 to 2017 i.e. a decrease of 3.9% for women as compared with 1.7% for men, although the women’s labour force participation rates have increased in the same period. This shows that although more women are entering the workforce, they are working fewer hours. This may be due to women needing more time to take care of the household and carry out other domestic responsibilities.
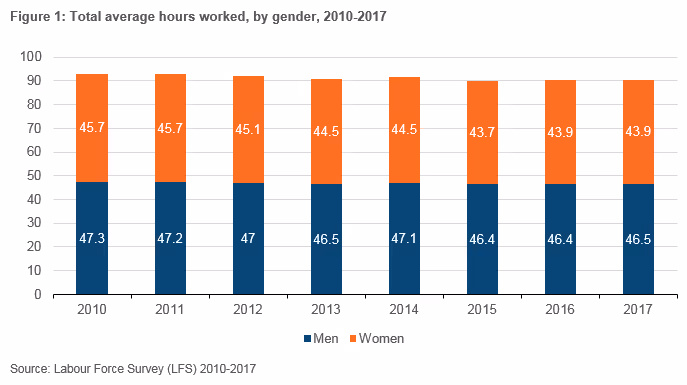
Figure 2 shows the gap in working hours for both men and women across all age groups. This was calculated by subtracting the average hours worked in 2017 by the average hours worked in 2010 for both men and women in each age group. All the age groups for both men and women show a decrease in hours worked between 2010 and 2017, i.e. both men and women are working less. The highest gap in working hours for both men and women are in the 35-39 age group.
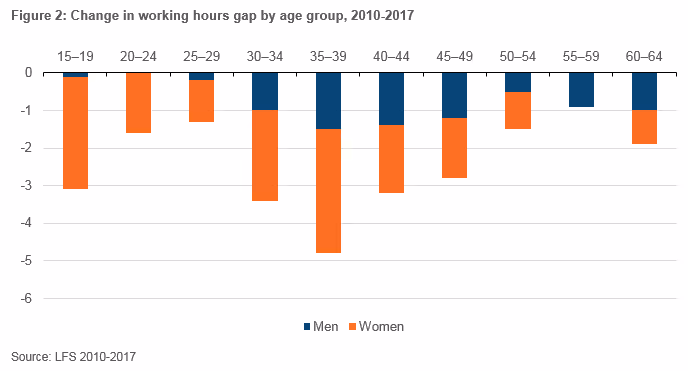
Figure 3 shows the average hours worked by occupation in 2017. The occupation with the highest average hours worked between 2010 and 2017 is plant and machine operators and assemblers at 49.2 hours a week, followed by managers and elementary occupations at 47.4 and 47.1 hours respectively. Professionals, on the other hand, have one of the lowest average hours worked at 42.2 hours a week. This finding for Malaysia is interesting because it contrasts with the work done by Warren (2003) in the United Kingdom who states that “time poverty is related to occupational class, with time scarcity intensifying higher up the occupational hierarchy”. In Malaysia, the higher skilled occupations tend to be ‘time wealthier’ than the lower skilled occupations.
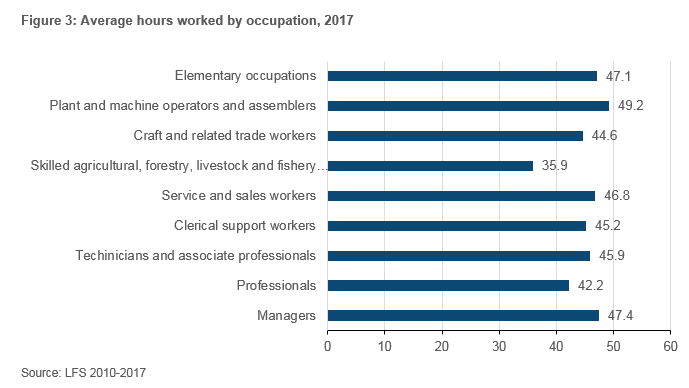
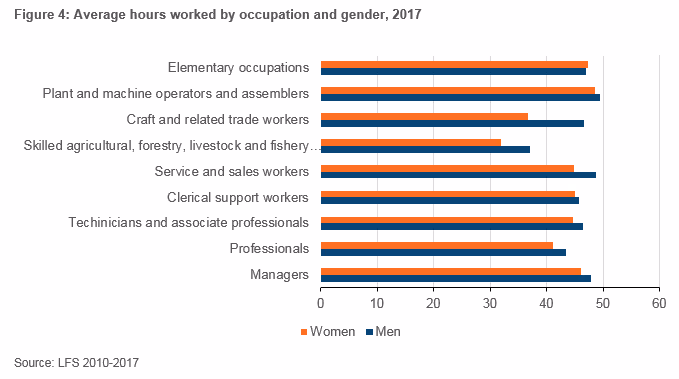
Figure 4 shows the gender breakdown of average hours worked across occupations in 2017. An important point to note is that for most occupations, men work more hours than women. However, for elementary occupations, which is also the occupational category with the lowest average and median wage, women work more hours than men. It points to a potential gender divide on the subject of time wealth and time poverty. Men tend to work more than women in all occupations except in elementary occupations where women work more than men.
However, the issue of gender divide of time wealth and time poverty must also factor in disparities in non-market time use, especially in unpaid care and domestic work. Literature suggests that paid work activities are predominantly done by men whereas unpaid care and domestic work are predominantly done by women (Harvey and Mukhopadhyay 2007). In Malaysia, housework not only contributes significantly to women dropping out of the labour force, but also to women in underemployment as compared with men.
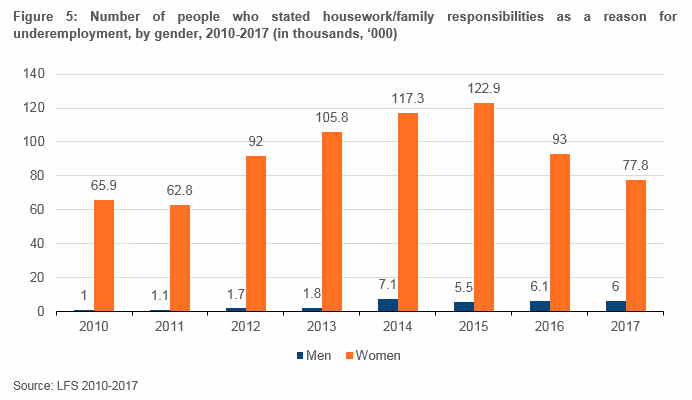
Figure 5 shows the number of men and women who have stated housework and family responsibilities as a reason for underemployment from 2010-2017. A significantly larger number of women stated housework and family responsibilities as the reason for underemployment as compared with men. This number translates to 32% of women who were underemployed because of housework as compared with a mere 2% of men. This indicates that women are more involved in unpaid care work as compared with men. Compared with Figure 1, although women work fewer hours than men, they might still be time poorer than men because much of their time at home is spent doing household chores and unpaid care work.
PART 3: FROM MARKET HOURS TO TIME USE SURVEYS
The analysis in Part 2 gives a brief overview of the time spent in the workforce by both men and women. However, data obtained from the LFS is very much limited to the average hours worked weekly and time spent in the workforce. It is not just the weekly hours worked, or time spent in the workforce that is an indicator of time wealth or time poverty. There are a few other factors relating to time that have to be considered. As stated by Warren (2003), besides the number of hours worked, knowing the time of work (day or night) and the nature of work will give us a more complete picture of an individual’s time wealth or time poverty. This brings about the concept of ‘quality’ time which is an important measure of time wealth for it is actually the wealth in quality time that makes a person time rich or time wealthy (Warren 2003).
Reisch (2001) states other dimensions of time that should be considered in assessing time wealth or time poverty, four of which are as follows:
- Chronometric dimension – having the right amount of time to carry out activities
- Chronologic dimension – having time at the right time of day, week or season according to a person’s individual, social and natural rhythms
- Time synchronization – having time that is aligned with the time patterns and rhythms of family, friends as well as with relevant social institutions
- Personal time autonomy/time sovereignty – having the ability and flexibility to determine the pace, working hours, and content of one’s time
The essence of the concept of time wealth is having the right amount (chronometric dimension) of quality time outside of work. This requires data and analysis on time use in the non-market sphere. As highlighted above, even when women work less than men in terms of market hours, it doesn’t necessarily mean that they are time wealthier as they could be spending a significant amount of non-market time doing unpaid care and domestic work.
Activities should also be carried out at the right time of day or season (chronologic dimension) to fully maximize the quality of leisure time. This may particularly impact the lower income community, working in jobs with irregular hours e.g. late-night jobs, overnight shifts, etc, that have the potential of disrupting a person’s chronologic time.
Related to chronologic time is time synchronization. It has been shown that the most enjoyable time spent by couples is the time they spend together and they tend to synchronize their time to optimize the time spent (Sullivan 1996). However, if other members of the family or friends are not available to spend time because they are working, at school or doing work related to unpaid care, the quality of leisure time will be affected. Women are at a risk of having the quality and quantity of their leisure time affected as they are more involved in household responsibilities and unpaid care work compared with men.
Time sovereignty, on the other hand, is often associated with informal work or higher paid jobs (Reisch 2001; Warren 2003). The ability to decide when to work and when not to and have flexibility over one’s work time is essential in synchronizing time with family and friends in order to maximize the quality of one’s leisure time. From Figure 3, the fewer average hours worked by individuals working in higher skilled jobs indicate that they are more likely to have a higher degree of time sovereignty and hence are more able to synchronize their time with others. However, this is just a preliminary assumption and a time use study is needed to get a more accurate picture on the relationship between occupational class and time sovereignty.
As can be seen in Part 2, data on time use in Malaysia is limited only to time spent by men and women in the workforce, or in other words time spent in market activities. Little is known about how people spend their time outside of work. Data on time spent in non-market activities is essential for an understanding of the dynamics between market and non-market activities. Therefore, it is essential to carry out time use surveys to get a clearer picture of how people are spending their time. Time is undoubtedly an important component of one’s well-being. To conclude, it really is time to think about time.