


New measure, old assumption
The government has recently revised its methodology in calculating the Poverty Line Income (PLI), a measure used to estimate absolute poverty in Malaysia. This has resulted in a more than two-fold increase in the average PLI, rising from RM980 per household per month in 2016 to RM2,208 in 2019. The absolute poverty rate went up substantially to 5.6% in 2019, but would have been at a much lower rate of 0.2% if the methodology was not revised¹.
While the revision in the PLI is a welcome move, as the upward revision reflects improvement in Malaysia's living standards, the methodology still maintains the debatable assumption that households rely solely on household production to meet their food needs. However, urbanisation, long working hours and increasing women's participation in the workforce are among the factors that could drive poor households to partly source their nutritional needs from eating out instead.
Therefore, the exclusion of pricing food away from home (FAFH) in the construction of the PLI³, which arguably is more expensive than preparing food at home, suggests that the true extent of absolute poverty is likely to be underestimated in Malaysia.
Figure 1 shows that low income households spent a considerable portion of their expenditure on FAFH. Low income households (<RM1,999; and RM2,000-RM2,999) spent between 9.8-11.6% of their total expenditure on FAFH. While the expenditure share on food at home (FAH) was higher, the share decreased from 2014 to 2019, highlighting the increasing importance of FAFH relative to FAH over time.
In terms of food share, the expenditure on FAFH increased from 24.4% in 2014 to 28.4% in 2019 for households with income below RM1,999, and increased from 26.5% to 32.3% for households with income range of RM2,000 to RM2,9999 (Figure 2). In other words, out of every RM10 spent by low income households on food, the amount spent on FAFH increased from about RM2.5 to RM3, reinforcing the growing significance of FAFH in their food consumption patterns.
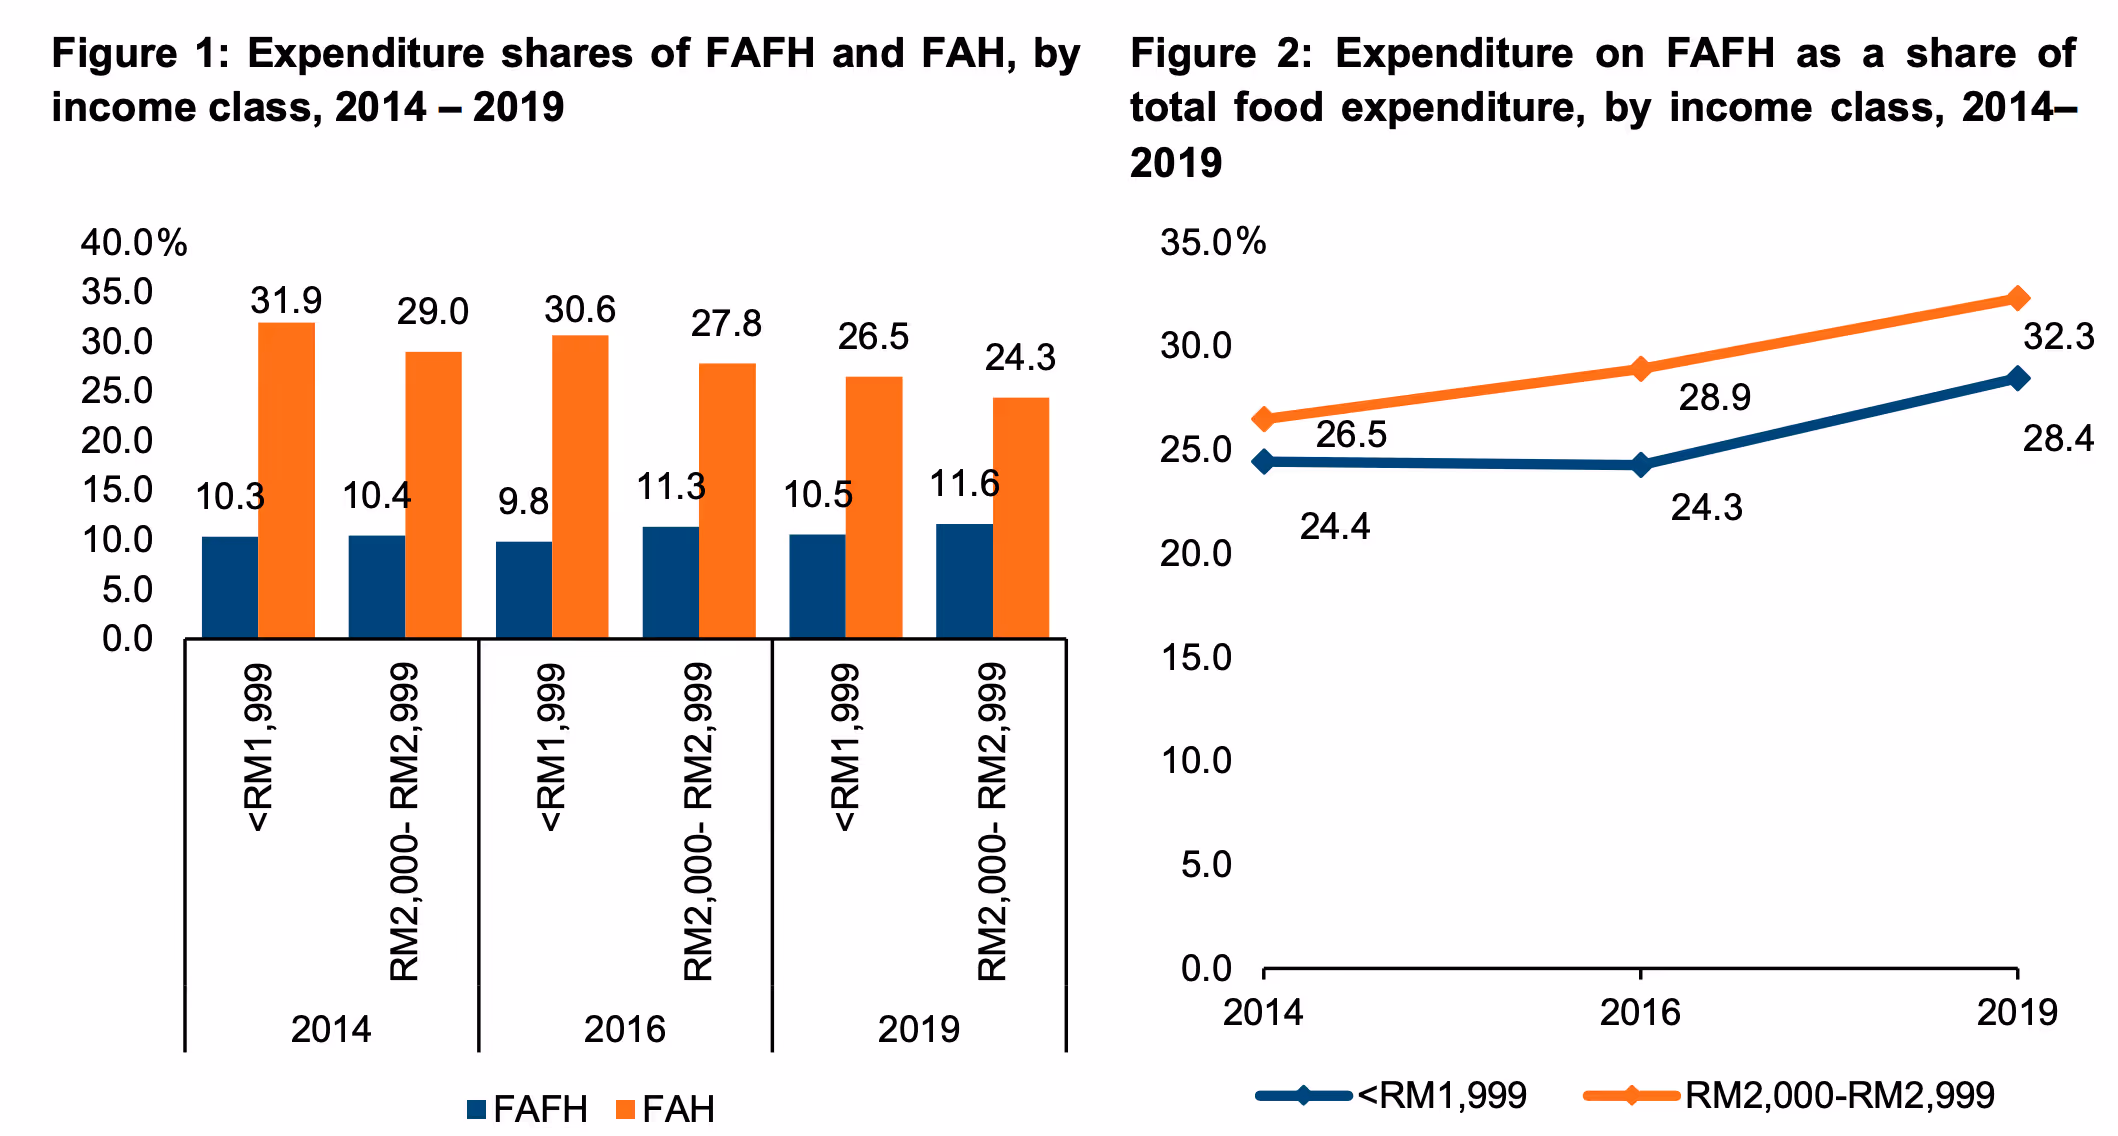
The above trends have two important implications: (1) the substantial portion of expenditure spent on FAFH suggests that eating out is not only confined to those in higher income classes. Instead, low income households are compelled to purchase parts of their dietary requirements from the market, largely driven by time scarcity, often caused by working conditions and rigid working schedules; and (2) eating out is generally more expensive than eating at home, suggesting that the same amount of income would obtain less amount of nutrients for eating out, ceteris paribus.
Low income households that have long working hours and low flexibility in their working schedules would opt to eat out as they do not have sufficient time to prepare every meal at home. Expenditure on FAFH becomes more necessary as the time available for household production, such as cooking, reduces.
KRI (2019), using a small-scale time use survey in Klang Valley, found that 61.5% women and 48.0% men in low income households were time poor. This is consistent with research that finds low- and medium income households eating out more to cope with high workloads and the lack of control over their working conditions5.
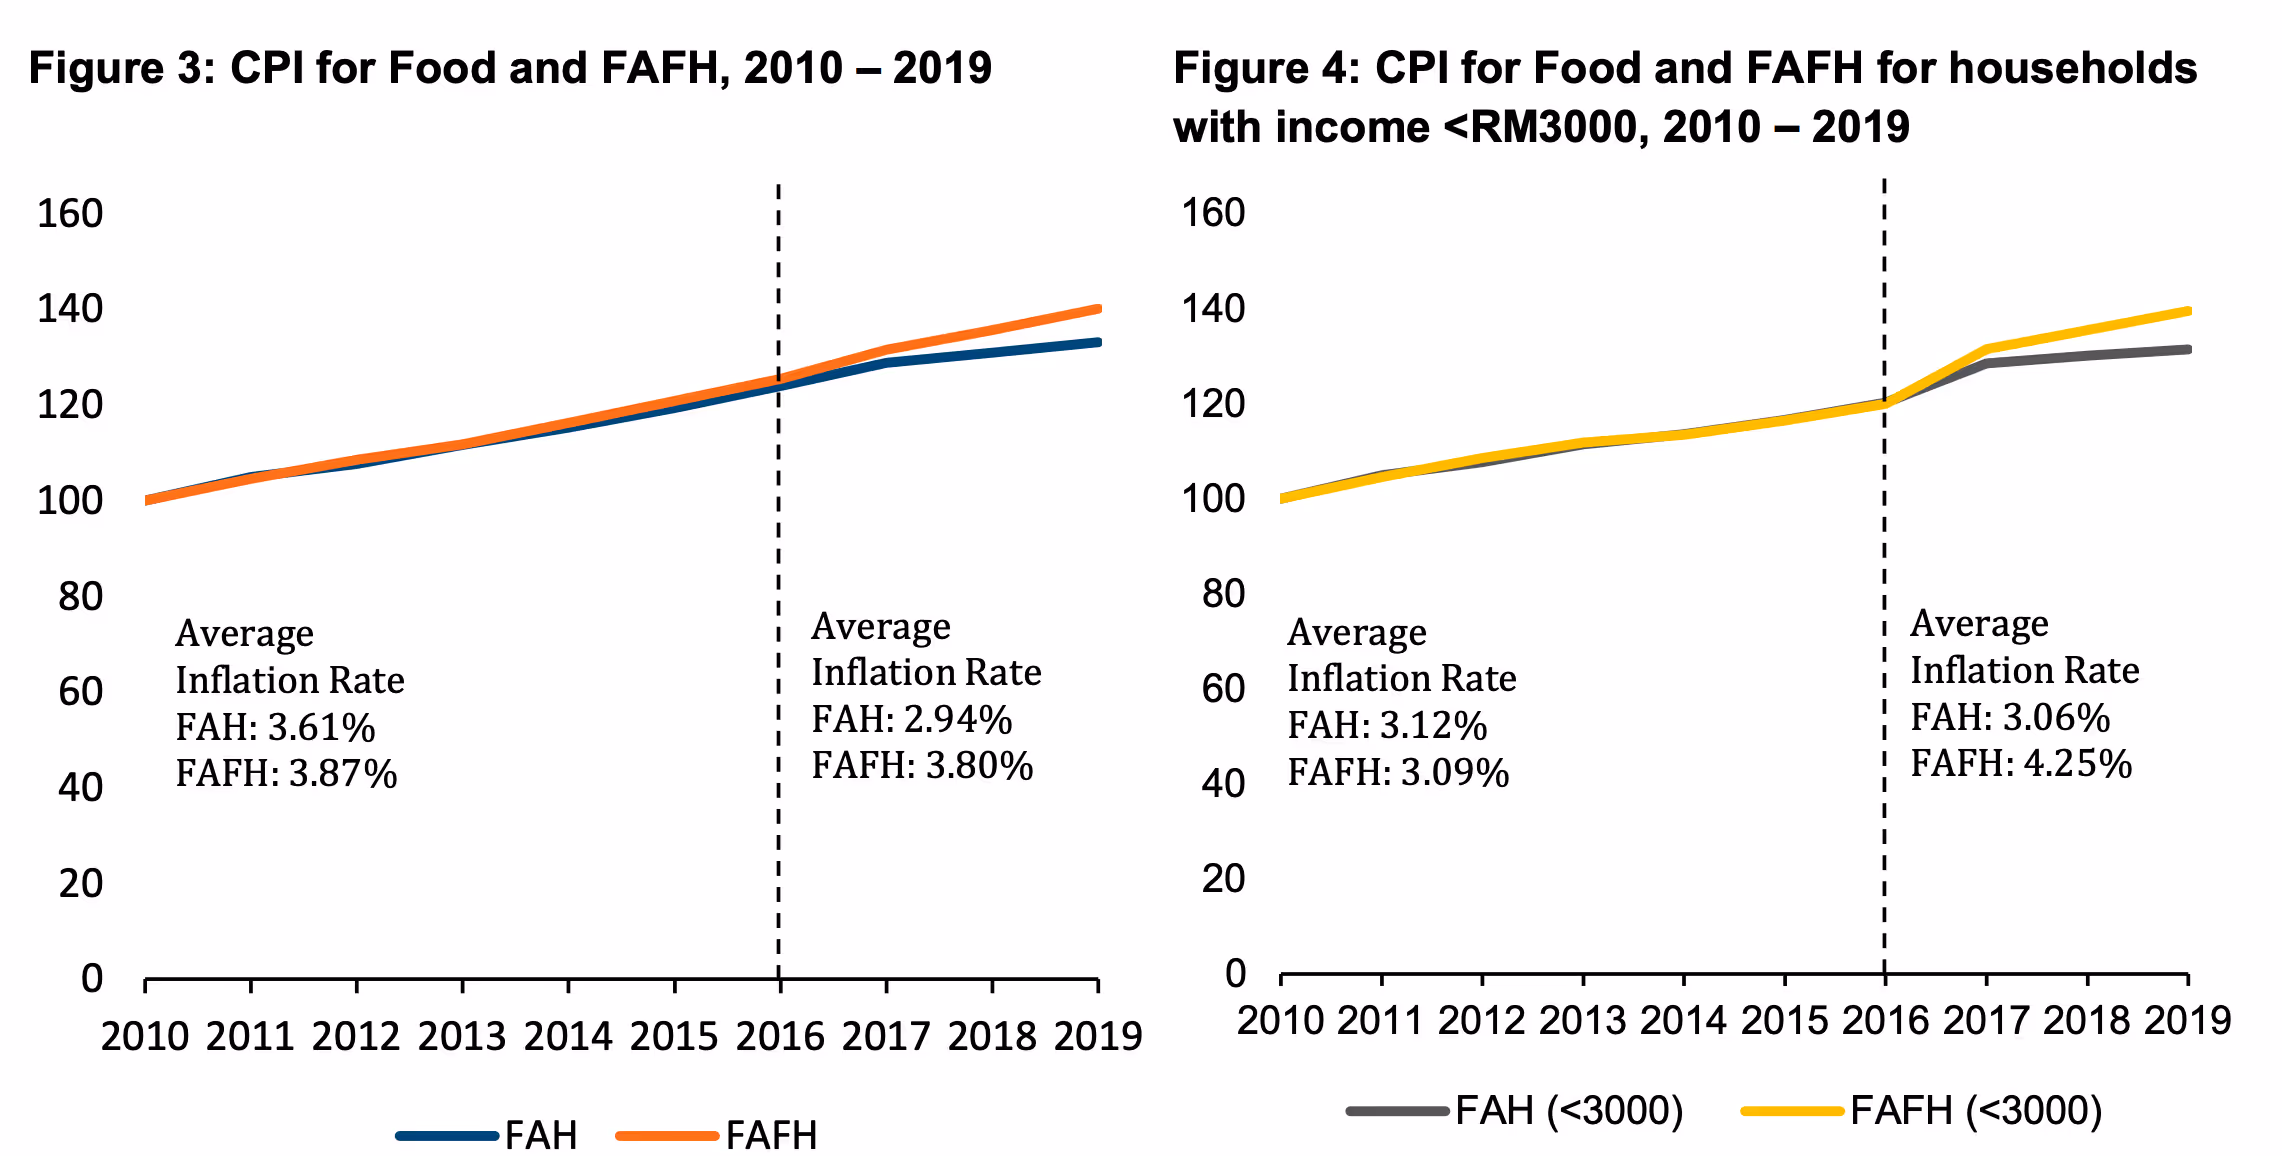
Eating out has also become more expensive in recent years, especially for low income households. As shown in Figure 3, the consumer price index (CPI) for FAFH had been increasing faster than the CPI for FAH from 2010 to 2019. For households with income below RM3,000, the CPI for FAFH deviated sharply from the CPI for FAH since 2016 (Figure 4), indicating the increasing cost of living for low income households caused by changing food consumption patterns. Hence, it is reasonable to infer that while low income households spent more on FAFH, they were purchasing less in absolute amounts, leading to the risk of malnutrition among these households. As shown in the 2015 National Health and Morbidity Survey, households in low income brackets were exposed to a higher risk of underweight and stunting6.
Eating out: more urban, younger
The expenditure share of FAFH for urban households was higher than their rural counterparts from 2014 to 2019. Figure 5 shows that the expenditure share of urban households with income below RM1,999 exceeded that of rural households by 4.3 percentage points in 2014, 1.8 percentage points in 2016 and 2.6 percentage points in 2019. While this does not mean that eating out was insignificant for rural households, it does indicate the higher indispensability of FAFH for urban households, with the expenditure share of FAFH constantly above 10%.
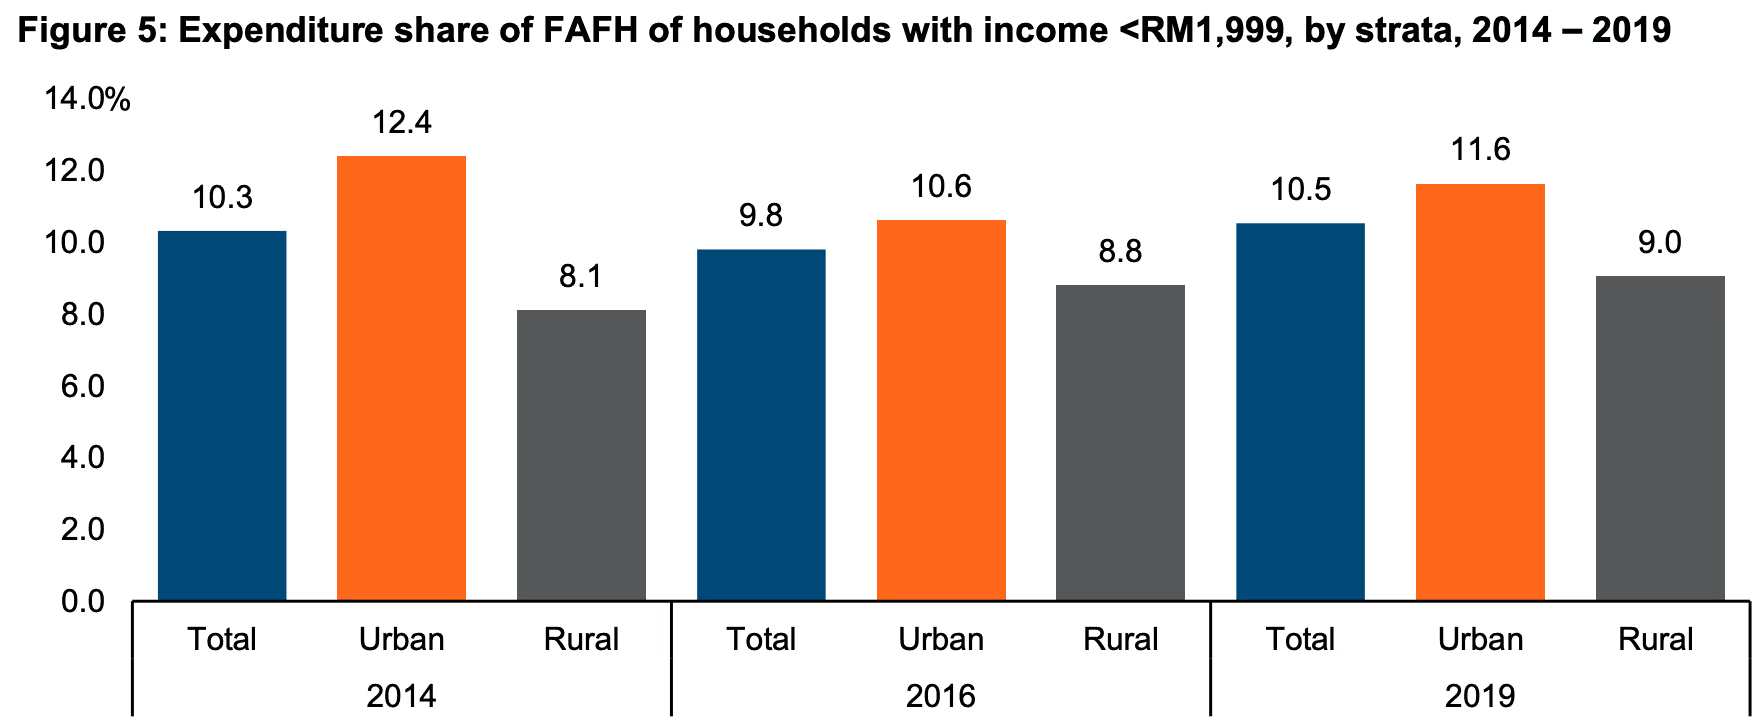
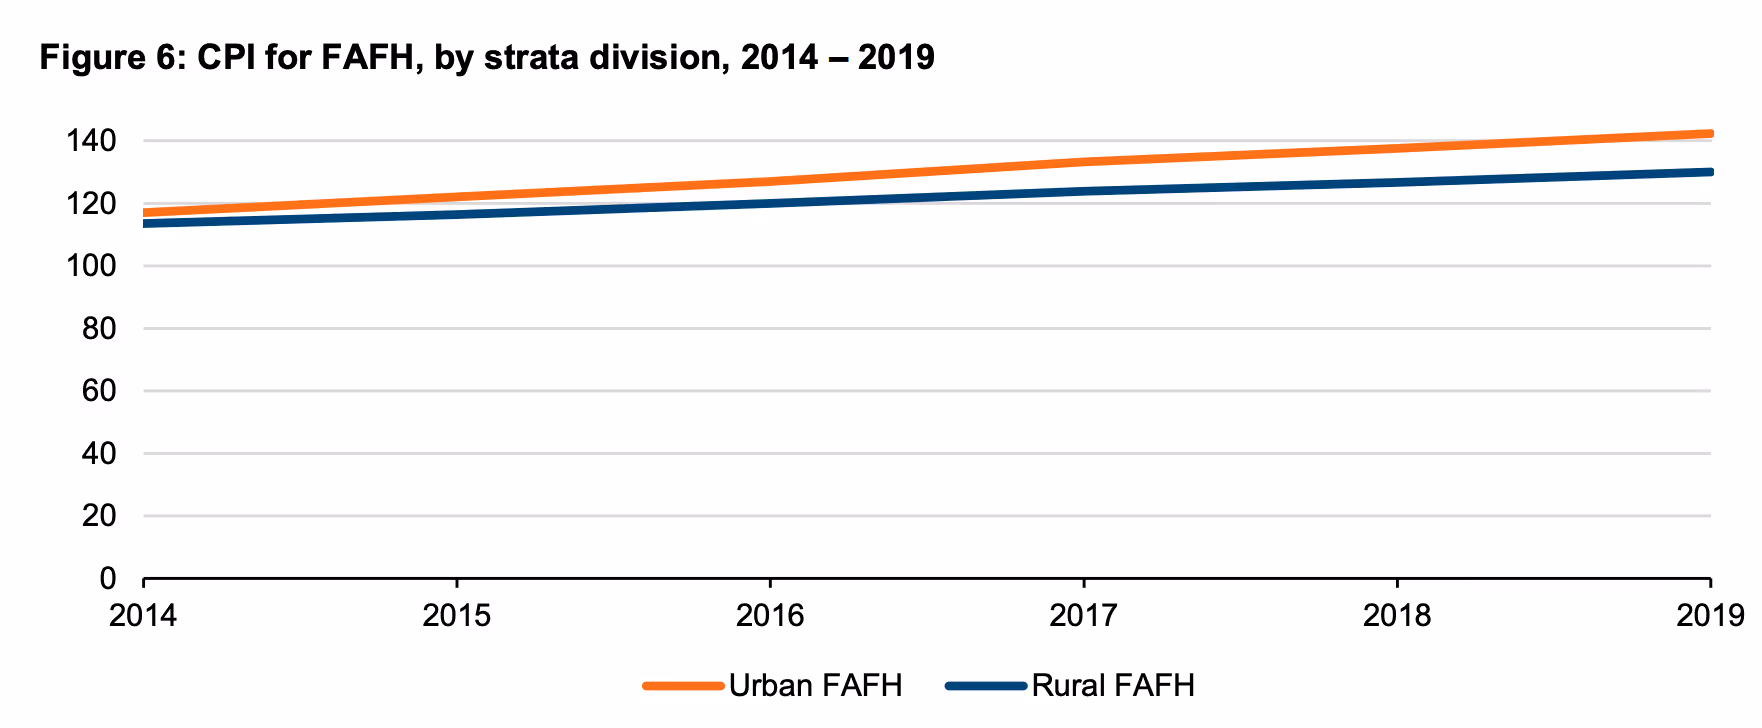
Figure 6 further shows that urban households also faced a more rapid increase in the CPI for FAFH, indicating a heavier burden for them compared with rural households. Despite spending more, there was a higher probability that urban households were not necessarily obtaining more food in absolute amounts, disadvantaged by the stronger inflationary effects of eating out in urban areas.
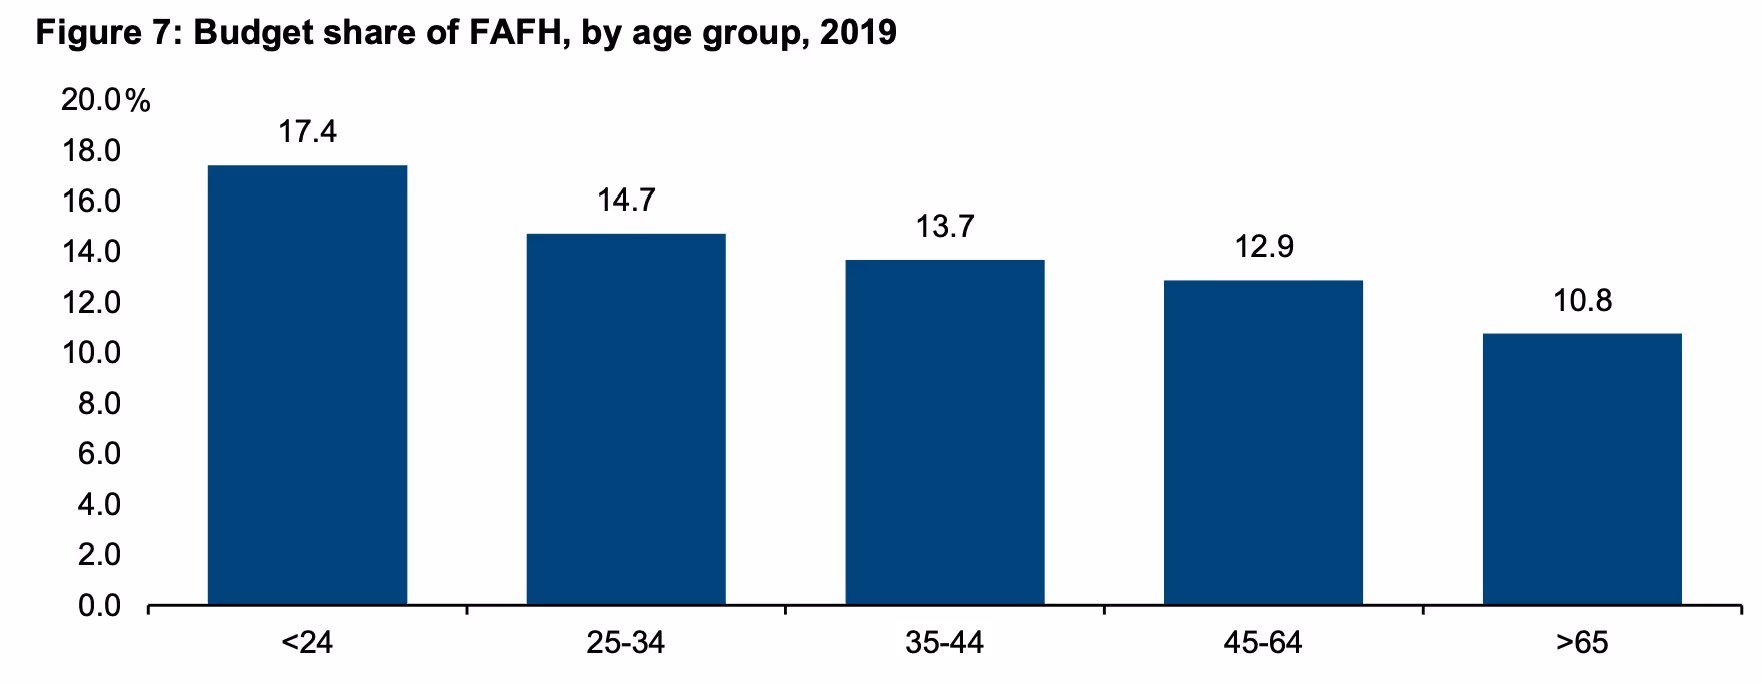
Younger households also tend to have a higher expenditure share of FAFH. In 2019, households with head of households aged 24 years old and below spent 17.4% of total expenditure on FAFH, while households with head of households aged 65 and above spent 10.8% (Figure 7). A reasonable explanation for this difference could be that younger households were more likely to be single or had smaller household size, hence find it more cost and time effective to eat out, while older households had formed families with children and thus, eating meals prepared at home would be more conducive and convenient.
Hence, building on the perspective of strata division and age groups, it could be inferred that eating out is more prominent among urban dwellers and younger households. While we shouldn't conclude that urban and younger households are worse off due to their higher expenditure share of FAFH, it does point to the higher likelihood that these households are counted as non-poor when the PLI is constructed without incorporating eating out as a component.
Small tweaks, gradual shifts
To minimise exclusion errors, and expand the depth and breadth of social assistance, the PLI can be adjusted upwards by incorporating the costs of FAFH. This can be done by bumping up the price of the food basket by a certain percentage, which could be determined by referencing the differences in price between FAH and FAFH. In addition, the portion of the food basket attributed to FAFH could be weighted using the expenditure share, capturing the necessary living costs from eating out.
Alternatively, we could draw on the time use approach to adjust the PLI. This is done by calculating the time deficits of households, highlighting the extent that households do not have the time to undertake various forms of household production including cooking. The intuition is that these households would then have to substitute these items with purchases from the market at a higher price. Therefore, time deficits are imputed with a monetary value, which is then used as the basis to adjust the PLI upwards. KRI (2019) has added about RM500 to the relative poverty line of RM2,100, when they applied this method to the small-scale time use survey sample to account for unpaid care work. To implement this option, a time use survey needs to be conducted on a larger scale to enable a more accurate estimation of time deficits, which have implications not only for eating out, but a whole range of market substitutes for household production e.g. childcare, laundry, cleaning services.
Besides adjusting the PLI upwards to account for the higher price of eating out, another option is to construct specific food baskets that are tailored to different demographic groups. Given that younger households had higher expenditure share of FAFH, we could explore constructing a youth-specific PLI, with its own food and non-food baskets, that pays due attention to eating out, to better capture the needs of youths. As a start, these baskets could be constructed for youth-headed households in selected urban areas, especially given the higher expenditure share on FAFH in urban areas. A similar approach has been applied to senior citizens in the United States, indicating that an age-specific PLI is feasible and probably desirable to produce more targeted social policies and assistance.
In conclusion, while the recent revision of the PLI should be applauded, we should constantly strive to achieve a more accurate reflection of poverty in our society. One potential source of exclusion error and underestimation of poverty is the assumption that all food sources are prepared at home, without sufficient attention given to rising expenditure share and price of FAFH, especially for low income households. This is particularly pertinent for urban and younger households, where a youth-specific PLI can be explored in selected urban areas. Tweaking the PLI upwards by accounting for the higher price of FAFH is also feasible, but a more gradual shift to incorporating the whole range of household production using a time use survey is more desirable in the long term.


.avif)
.avif)