


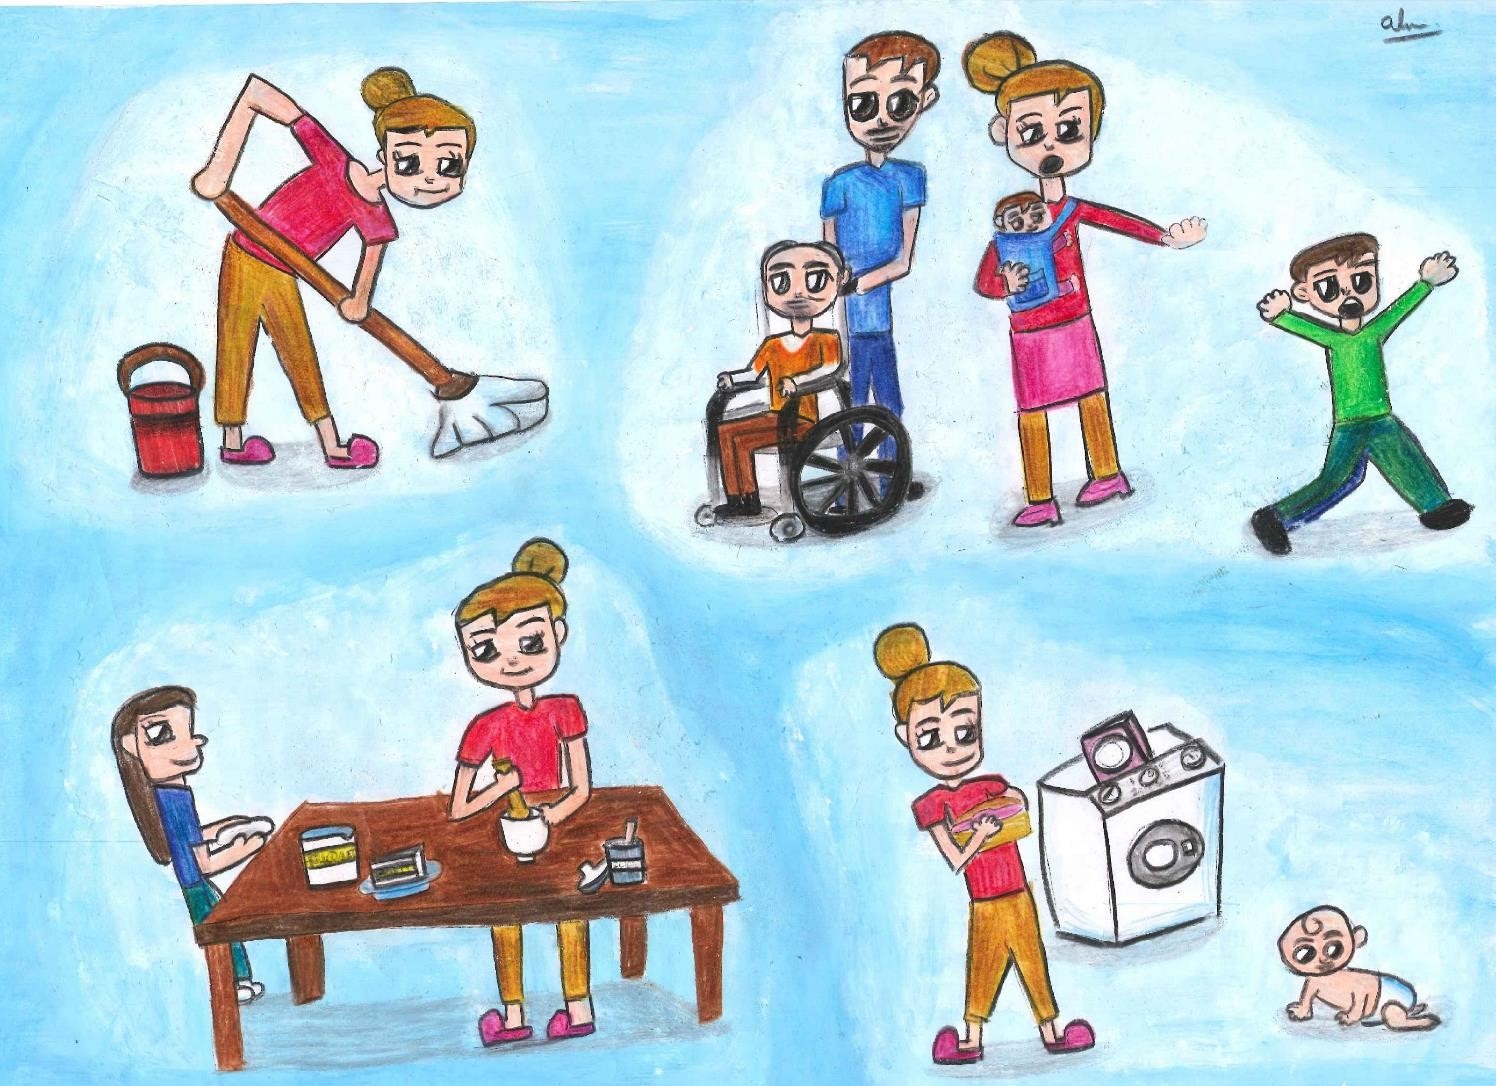


This interactive visualisation accompanies our report ‘Time to Care: Gender Inequality, Unpaid Care Work and Time Use Survey’. The report looks into the landscape of invisible and unpaid care work in Malaysia and its links to gender inequality, a phenomenon we uncover further with a time use survey.
We present a series of interactive charts to explore how a small segment of people in Kuala Lumpur (125 people) belonging to different backgrounds spend their time, based on a pilot time use survey we carried out in 2018. For more information on the time use survey methodology and our pilot study, refer to our FAQ.
Explore the data visualisations below to see the insights that can be drawn from time use data, including how people spend their time, variations in time use across groups (e.g. gender and income groups) and over the course of a day, as well as how people move about.
How do people spend their time?
A time use survey measures how people allocate their time across different categories of activities, such as paid work, unpaid housework, unpaid caregiving and leisure. It is a particularly useful tool to capture non-market activities (i.e. activities that aren’t paid) to give a more complete picture of the total economy, consisting of paid and unpaid work. Data collected can have many applications and can shed light on a range of socioeconomic concerns of a population.
In our study, we assess the data from our pilot time use survey through the lens of gender inequality in unpaid care work and labour market outcomes. To do this, we first classified all activities carried out by the respondents into seven major categories. Across these categories, respondents on average spent most of their weekday time on Self Care (9.1 hours), which includes sleeping and grooming. This is followed by Paid Work (6.8 hours).
How does your time allocation compare?

How does time allocation differ for different people?
Intuitively, different people spend their time in different ways. One way of splicing time use data is by gender to explore gaps in how men and women spend their time.

We find that men and women in our sample dedicated a similar amount of time to paid work. However, women spent more time than men on both domestic and direct care work. This points to a double burden faced by women—a time squeeze that comes from having to juggle both work and family responsibilities. Consequently, women spent less time than men on leisure as well as social & religious activities.
How about other groups? How does time allocation differ between those with children and those without? And how would these patterns change based on location, whether travelling is excluded and who these activities were performed with?
Use the filters to disaggregate the data further.
For example, splitting the data by a four-stage life cycle demarcation defined by the presence and age of a person’s youngest child, we see that the double burden is much more intense for women in life stage 2 (in which the youngest child is below 7 years old).
By exploring travel time, we find a striking observation that men travel more. Additionally, excluding travel from the calculations reveals that women dedicate more time to paid work than men.
How do people spend their time on specific activities?
How does time allocation look beyond the broad categories of activities? For example, what kind of tasks do people dedicate most of their time on when it comes to domestic work? And how does this task allocation differ between men and women?

In our sample, most of the time allocated to domestic work was spent on food preparation and cleaning, especially for women. On the other hand, men spent a considerable amount of time travelling for domestic work, even more than women.
What about simultaneous activities?
People often do more than one activity at a time, often to cope with multiple responsibilities throughout their day. It may be useful to see how certain activities take place alongside other main activities.
In our sample, leisure and socialising appears to be a prominent simultaneous activity for both men and women, taking place alongside many categories of main activities. .
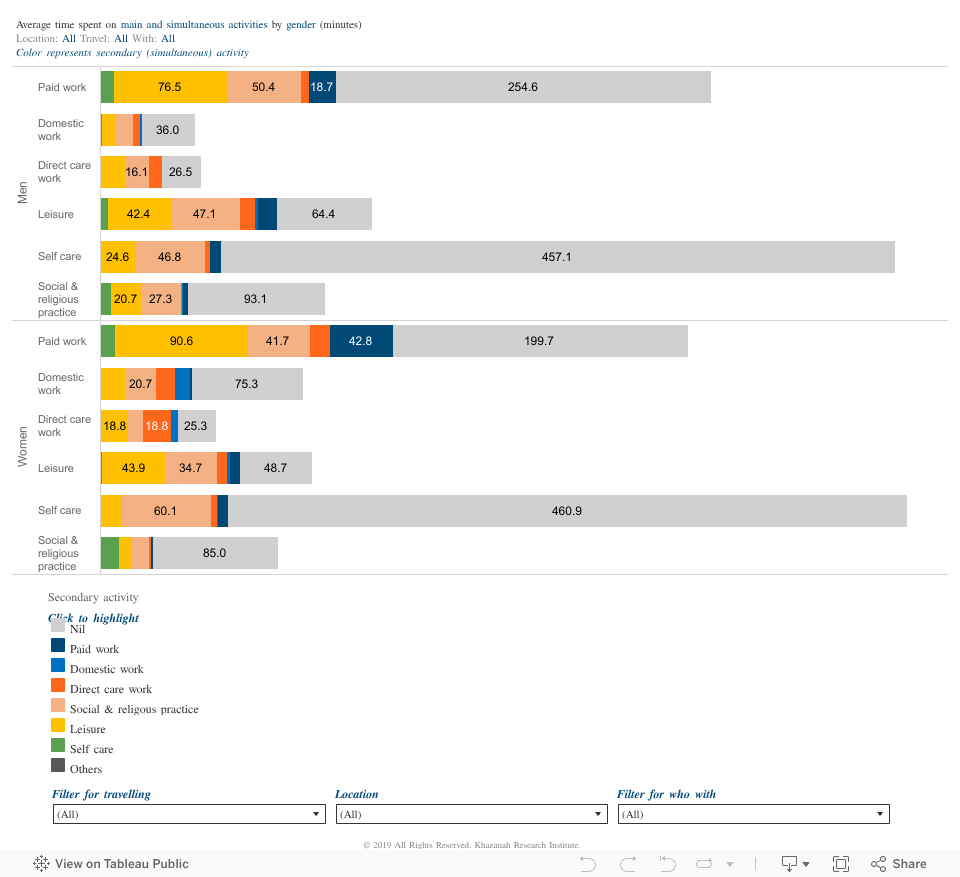
We also find a considerable amount of domestic and direct care work being performed as simultaneous activities. Particularly for women, some of these household tasks were actually performed simultaneous to other domestic and direct work tasks. For many, this could be something like cooking a meal while watching after a child. The act of juggling such tasks can reflect an added intensity of unpaid care work.
How is time allocated to activities throughout the day?
We established how people allocate their total time to different kinds of activities.
But understanding people's lives by simply looking at the total time spent in activities may mask the true realities of the quality of the time spent. For example, leisure time that is spent in fragments rather in long continuous episodes with disruptions due to family responsibilities may reduce the quality of the leisure time.
Therefore, how exactly are people's activities distributed throughout the day? When, for example, do people have their leisure time and when is the bulk of care work performed? To what degree are people's time spent segmented?
Our survey allows us to explore this in greater detail. For starters, below is an example of a selected individual respondent. Choose other respondents in the filter to see how they spent their day.

But is there a pattern of how time is spent throughout the day across the whole of society?
We explored this question for our sample population in the interactive chart below.

Sorting respondents by the total amount each person dedicates to paid work, a clear pattern emerges. Unsurprisingly, much of paid work is concentrated during daytime, from about 8am to 5pm, with a break in the middle for self-care (mostly in the form of eating).
Interact further to see how other activities are distributed across our sample, including travel, as well as see where most people are throughout the day.
The illustration below provides a different perspective. To show the magnitude of respondents engaged in the major categories of activities, the height of the bar represents the number of respondents in the particular given activity at any given time.

How and where do people travel?
We visualise the travel patterns of our respondents, starting with a selected few. The more lines there are, the more trips that were made. The longer the line, the further the trip.
Starting with a working mother and a working father, how do their travel patterns differ?

Drag the time filter slider to see how their travel patterns shape throughout a day. Alternatively, select other respondents to view.
How about everyone else?
The map below charts the movements of all our respondents. For ease of comparability, everyone’s home location is set at the centre of the map.

As shown, a noticeable observation is that men in our sample not only travelled more often than women, they also travelled further. The prevailing theory is that women's mobility is more likely constrained by care and family responsibilities. Nevertheless, it is apparent that for both men and women, much of their travel time on a weekday is dedicated for paid work as opposed to other activities.
Interact with the filters for further insights, including to see how these travel patterns vary throughout particular times of the day.
What modes of transport do people use most?
Our male respondents spent more time on travel (2.9 hours) than their female counterparts (1.9 hours). But what modes of transport did our respondents mostly use?

Cars were by far the most popular option as expected, accounting for more than half of men and women's travel time. However, while about half of travel time was spent as a passenger in a car for both men and women, men spend more of their travel time as drivers. Men also used motorcycles more than women, while women relied more on public transport such as trains, buses and taxies/e-hailing.
Where do people spend their time?
Most of our respondents spent their time at home. Including the time spent travelling to home, women spent 14.9 hours in total at or travelling to home, while men spent 13.1 hours. This is followed by the workplace, where women also spent more of their time than men.

If we exclude travel time, the amount dedicated by women to paid work (5.8 hours) is more than men (5.3 hours). For women, much of this time was spent at home and the typical workplace (e.g. employers office), whereas men spent more of their time at less conventional places for work, which included commercial areas and eating locales.
What research questions do you have that may be answered using time use data? What patterns can be observed and what inferences can be made? How might policymakers benefit from time use statistics?
While our pilot time use survey is not meant to be generalised for the entire Malaysian population, our study illustrates the potential applications of the rich data that can be obtained through a national time use survey.

